


When a service business owner wonders whether to hire another technician, buy another truck or raise prices, one figure helps with all three decisions. Revenue per technician shows how much each person in the field brings in. It is simple to calculate, and because it rolls several other measures into one, it is a good early warning when something in the business has slipped.
How to calculate it
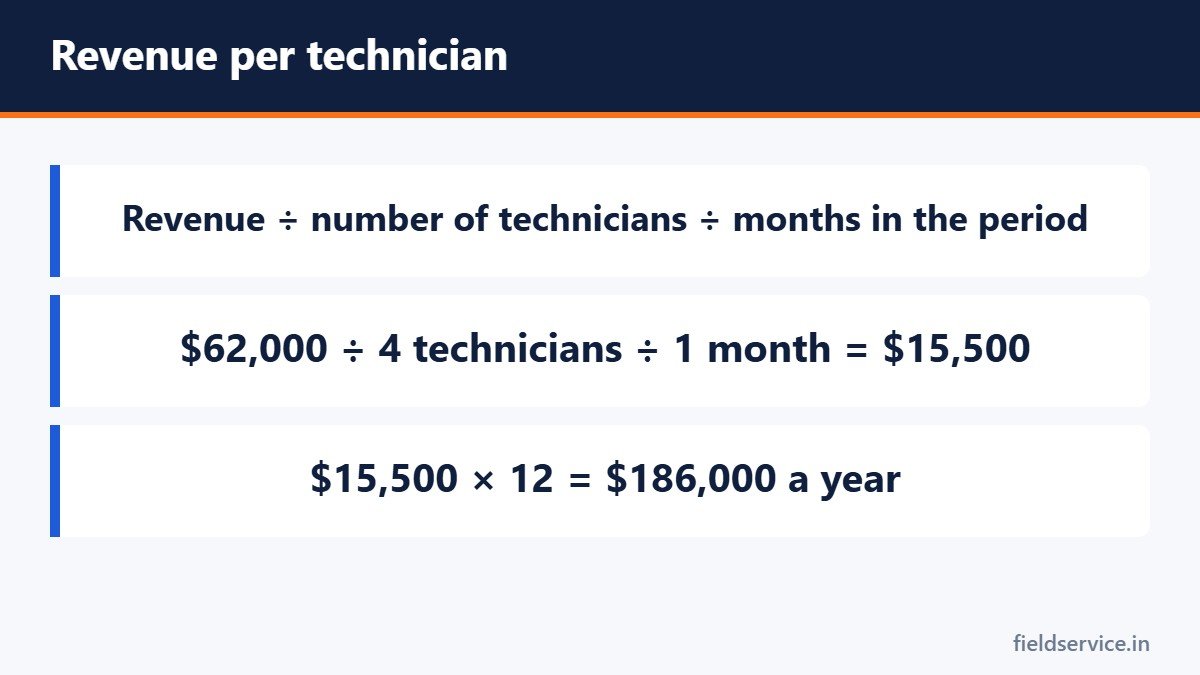
Divide revenue for a period by the number of field technicians who produced it, and by the number of months in the period. A business that billed $62,000 in a month with four technicians has revenue per technician of $15,500 a month, or $186,000 on an annual basis. The revenue per technician calculator does the arithmetic.
Get the inputs right
- Count full-time equivalents. Two half-time technicians count as one. An apprentice who rides along and does not run calls should be counted consistently, either in or out, every month.
- Decide which revenue to include. Service and installation behave differently. A single large installation can distort a month. Many businesses track service technicians and installation crews separately.
- Use the same period for both figures.
What drives the number
Revenue per technician is the product of three things:
- How many jobs each technician completes. This depends on scheduling, drive time and how long jobs take.
- How much each job brings in. That is your average ticket.
- How many days are worked. Vacations, training days and seasonal slowdowns all reduce it.
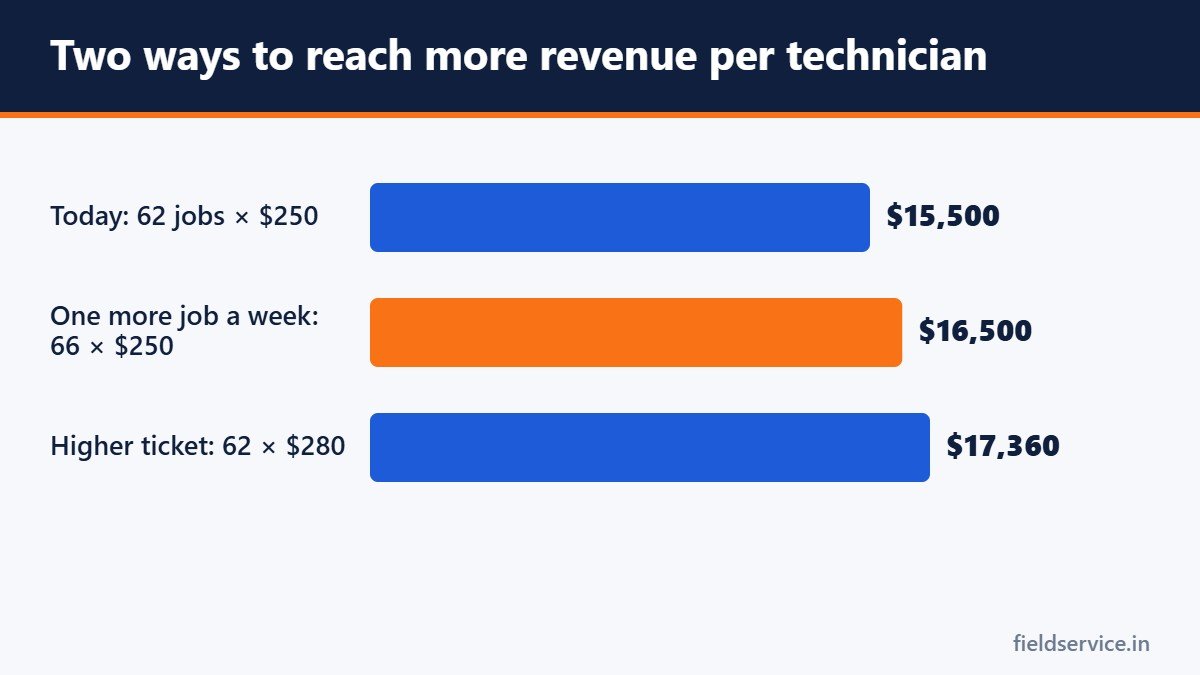
Put another way, revenue per technician equals completed jobs per technician multiplied by the average ticket. If each technician completes 62 jobs a month at an average of $250, that is $15,500.
How to raise it
Complete more jobs with the same people
Cut drive time by routing within zones, stock trucks so that parts runs are rare, and improve the first-time fix rate so that second visits do not use up appointment slots. Our article on dispatch and productivity covers the scheduling side.
Earn more from each job
Check your pricing against your costs, present options to customers and offer maintenance agreements. Raise the ticket only in ways the customer would thank you for.
Fill the slow periods
Maintenance visits scheduled for spring and fall keep technicians billing when demand calls are quiet. See maintenance agreements.
Using it to decide on hiring
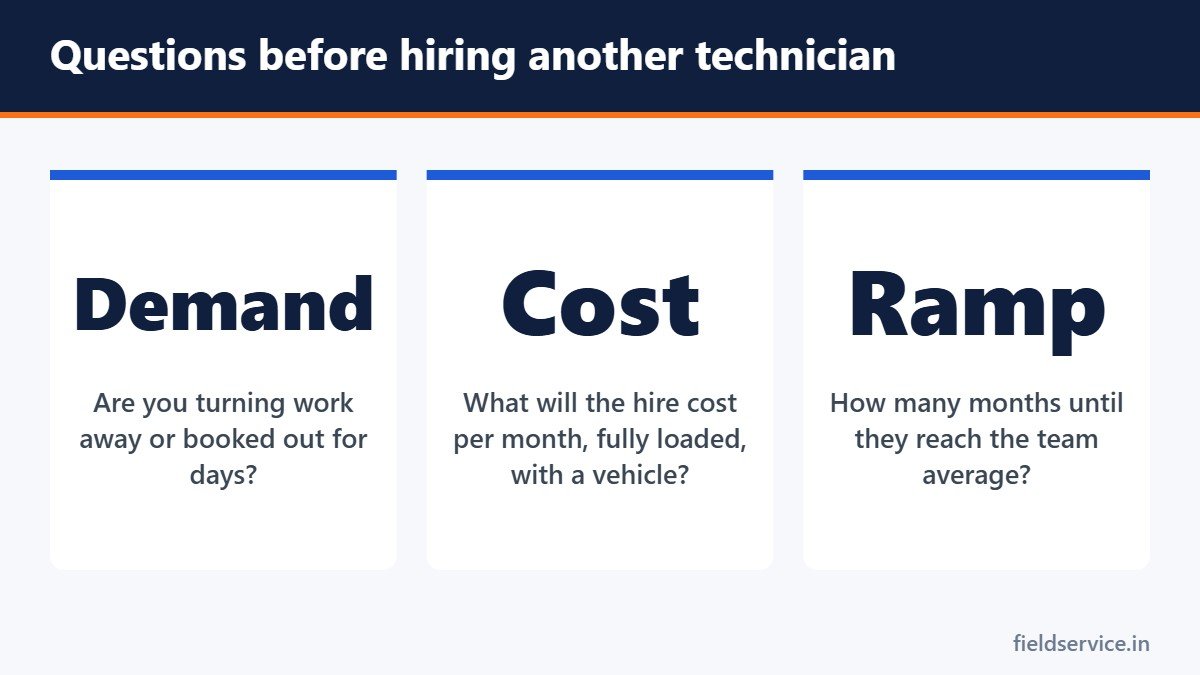
Before adding a technician, compare what a new hire costs with what a technician brings in. The cost includes wages, payroll taxes, insurance and benefits (see loaded labor cost), plus a vehicle, tools, fuel and a share of office support.
Then ask whether there is enough work. If your current technicians are booked out for a week and you are turning calls away, a new hire can reach the average fairly quickly. If the existing team has gaps in the schedule, adding a person will lower revenue per technician and raise your costs. In that case the constraint is leads or scheduling, and hiring will not fix it.
What it does not tell you
- Profit. High revenue from underpriced work is still a loss. Read it next to gross margin.
- Quality. Revenue can be pushed up by overselling or rushed work, which shows later in callbacks and reviews.
- Fair comparison between people. A technician sent to the hard diagnostic calls or the far end of the service area will show lower revenue through no fault of their own.
Seasonality
In seasonal trades the figure swings widely across the year. Multiplying a July number by twelve overstates the year, and a February number understates it. Compare each month with the same month a year earlier, and use a trailing twelve-month figure for decisions such as hiring.
Comparing with other companies
Benchmarks from other markets are of limited use. A commercial refrigeration company and a residential plumbing company have very different revenue per technician for reasons that have nothing to do with how well they are run. Your own trend over time is the comparison that matters.
A monthly routine
- Calculate revenue per technician for the month and for the trailing twelve months.
- Break it into jobs per technician and average ticket.
- Note which of the two moved.
- Look at the cause: drive time, schedule gaps, pricing or job mix.
- Choose one thing to change next month.
It is one of the seven KPIs we suggest every small service business track.
Related guides
- Per Diem for Field Technicians: How It Works
- How to Use a Multimeter: A Field Guide for New Technicians
- Close Rate: How to Measure and Improve the Share of Quotes You Win
Three Excel workbooks that take you from what a technician costs to what to charge, then show whether each job made money.
Not sure yet? Try two forms free or see all packs.
Frequently asked questions
How do you calculate revenue per technician?
Divide revenue for a period by the number of full-time-equivalent field technicians and by the number of months in the period. Multiply the monthly figure by twelve for an annual basis.
What is a good revenue per technician?
It varies widely by trade, market and job mix, so benchmarks from other businesses are of limited use. Compare your figure with your own past months and with your cost per technician.
Should installers be included?
Decide on a rule and apply it consistently. Many businesses track service technicians and installation crews separately because large installations distort the figure.
How does revenue per technician relate to average ticket?
Revenue per technician equals the number of jobs each technician completes multiplied by the average ticket. Raising either one raises the result.