

A service business can grow revenue in two ways: run more calls, or earn more from each call. Adding calls means more trucks, more technicians and more driving. Raising the average ticket uses the visits you are already making. That is why owners watch this number closely, and also why it is easy to chase in the wrong way.
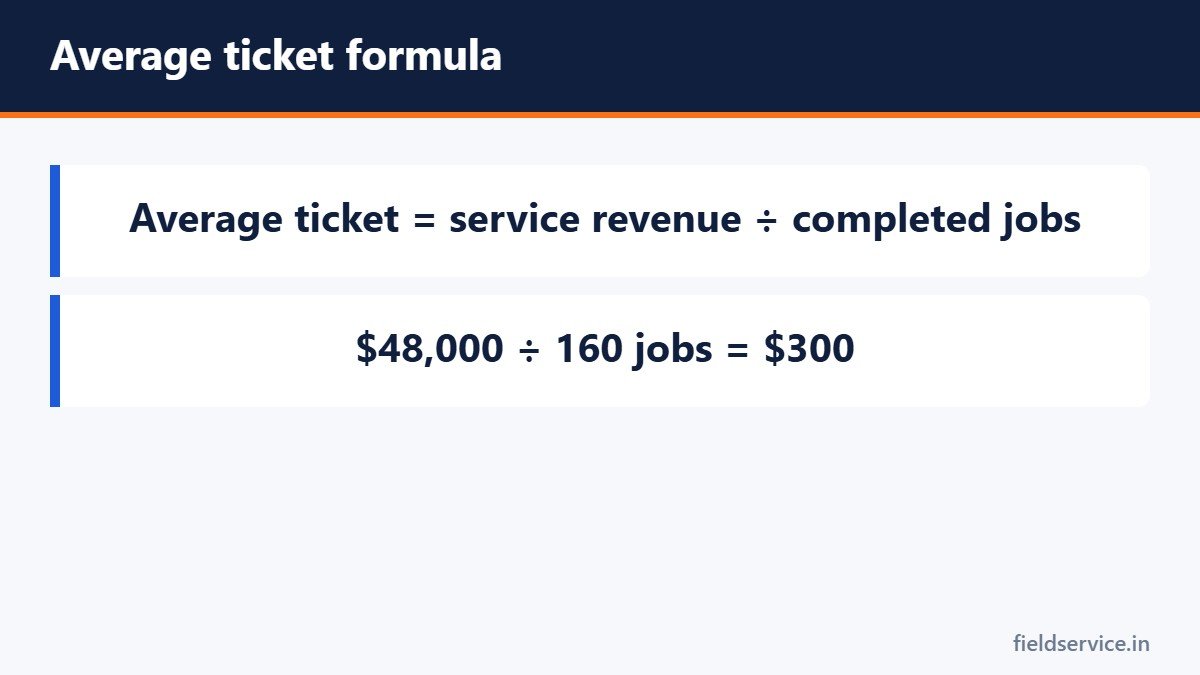
How to calculate it
Divide revenue for a period by the number of completed jobs in the same period. $48,000 from 160 jobs is an average ticket of $300. The average service ticket calculator also shows how far you are from a target and what closing the gap would be worth.
Separate your job types
A single average hides more than it shows. A $9,000 installation and thirty $150 maintenance visits average out to a number that describes neither. Track the average separately for:
- Repair and demand service calls
- Maintenance visits
- Installations and replacements
It is also worth looking at the figure by technician. The purpose is to see who might need training or support, not to rank people.
What a small change is worth
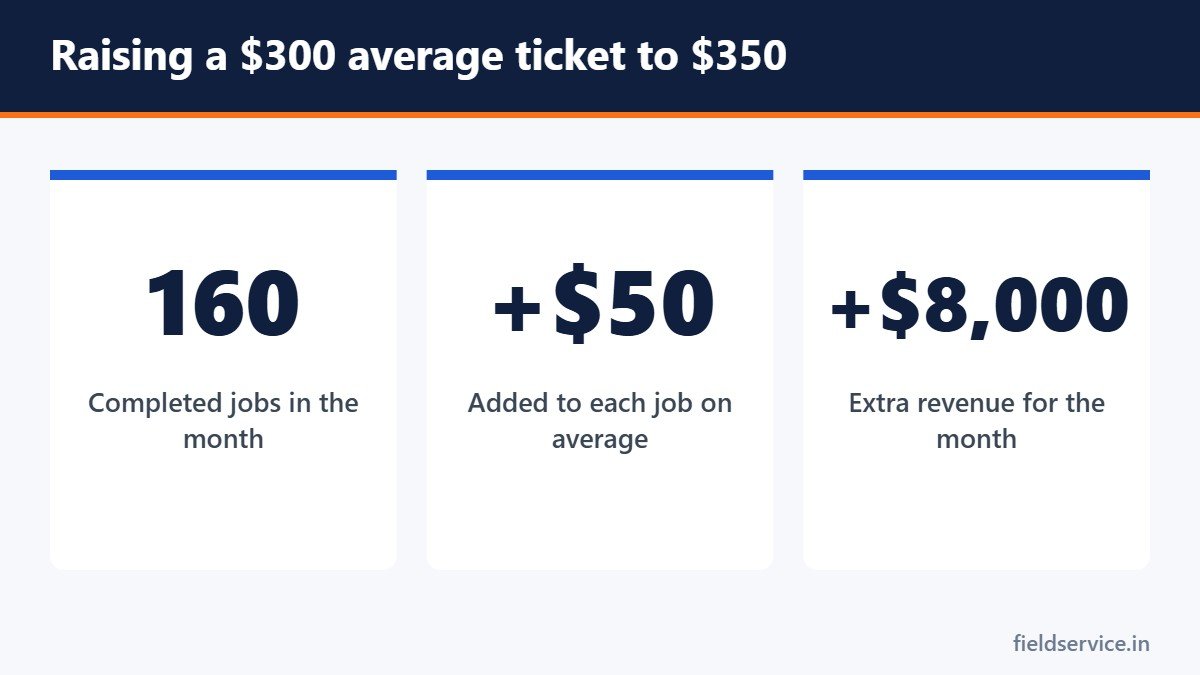
Using the example above, raising the average from $300 to $350 across 160 jobs adds $8,000 a month with no extra calls and no extra driving. Most of that increase reaches gross profit, because the cost of getting to the door has already been paid.
Ways to raise it that serve the customer
Inspect the whole system
A technician who fixes the reported fault and leaves has done half the job. A short, consistent inspection finds worn parts and safety issues the customer would want to know about.
Offer options
Present a basic repair, a more complete repair and, where it makes sense, replacement. Customers often choose more than the minimum when they can see what each option includes.
Explain findings clearly
Photos and plain language do more than pressure. Show the customer the worn part and explain what happens if it fails.
Offer maintenance agreements
An agreement adds to today’s ticket and brings the customer back for future visits.
Carry the common add-ons
Filters, batteries, surge protection and similar items are easy for a customer to say yes to when they are already on the truck.
Check your prices
Sometimes the average is low because the prices are. Compare them with your costs using how to price a service call.
The line not to cross
There is a difference between telling a customer about a real problem and selling work they do not need. Recommending unnecessary repairs raises this month’s ticket and costs you the customer, the reviews and sometimes a complaint to a regulator. A rising average ticket alongside falling reviews or more complaints is a warning sign.
Watch it with other numbers
- Close rate. If the ticket rises and fewer quotes are accepted, total revenue may fall.
- Callback rate. Bigger jobs done in a hurry come back. See the real cost of a callback.
- Reviews and repeat business. These tell you whether customers felt well served.
Average ticket is one of the seven KPIs we suggest tracking. Used with the others, it shows whether each visit is doing as much good as it could for the customer and for the business.
Related guides
- Temperature Split (Delta T): What It Tells You About an Air Conditioner
- How to Raise Prices in a Service Business Without Losing Customers
- How Dispatch Affects Technician Productivity
Three Excel workbooks that take you from what a technician costs to what to charge, then show whether each job made money.
Not sure yet? Try two forms free or see all packs.