


A small service business generates a lot of numbers and most owners look at only two of them: revenue and the bank balance. Both tell you what happened. Neither tells you why. A short list of key performance indicators, checked every month, shows where the money is made and lost. These seven are a sensible place to start.
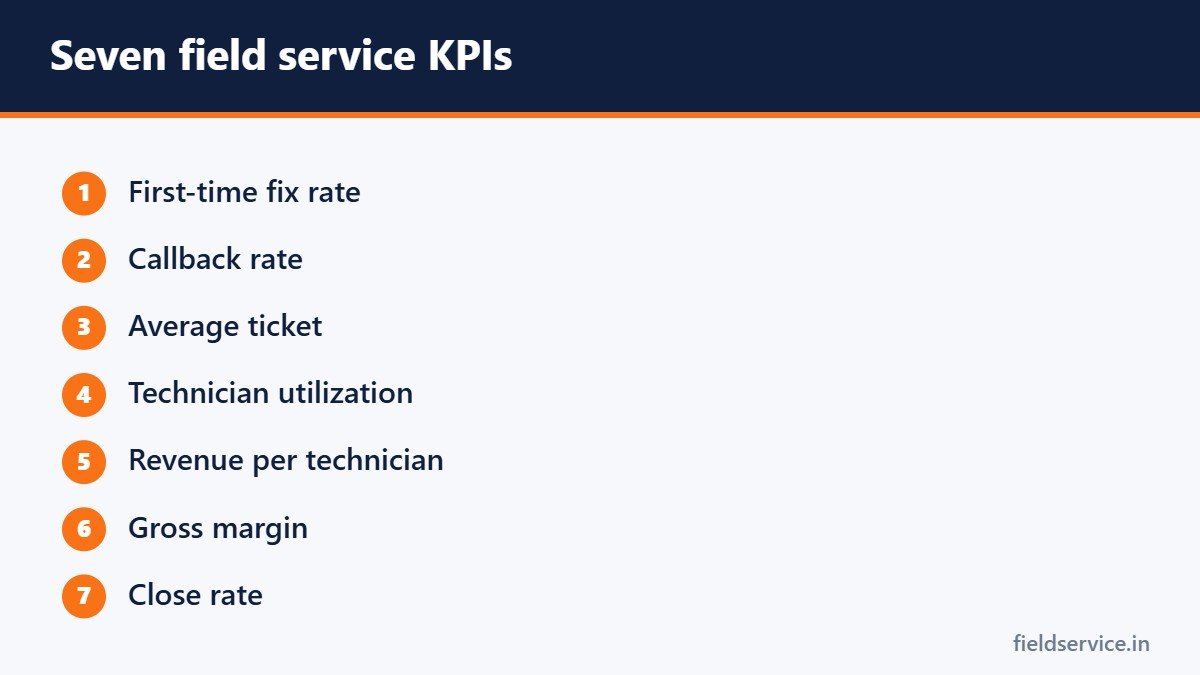
1. First-time fix rate
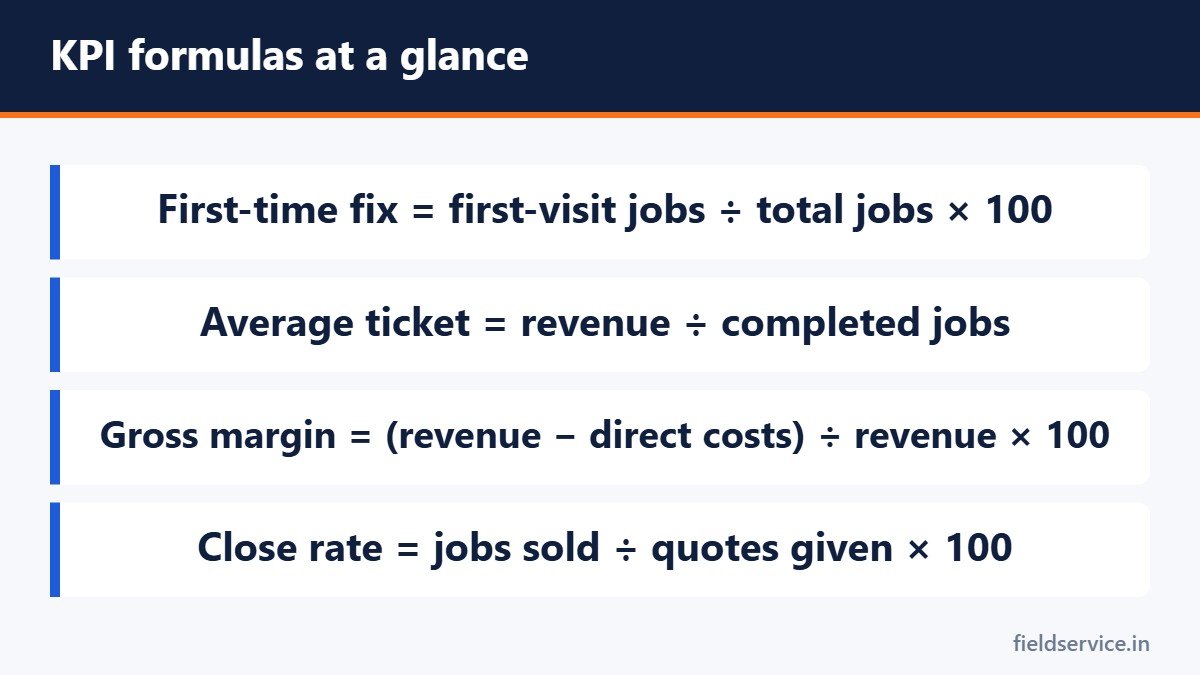
Jobs completed on the first visit ÷ total completed jobs × 100. It shows how well diagnosis, truck stock and scheduling work together. Read more in our first-time fix rate guide or use the calculator.
2. Callback rate
Callbacks ÷ completed jobs × 100. A callback is a return to fix work that was reported complete. It measures quality. See the real cost of a callback and the callback rate calculator.
3. Average ticket
Service revenue ÷ completed jobs. It tells you what a typical job brings in. Track it separately for repair, maintenance and installation. The average service ticket calculator also shows the gap to a target.
4. Technician utilization
Hours on jobs ÷ paid hours × 100. It shows how much of the payroll is spent on productive work. Details are in technician utilization explained.
5. Revenue per technician
Revenue ÷ number of technicians ÷ months. It combines utilization, pricing and ticket size into one figure and is useful when deciding whether you can afford another truck. Use the revenue per technician calculator.
6. Gross margin
(Revenue − direct costs) ÷ revenue × 100. Direct costs are labor, parts and anything else tied to the job. Gross margin has to cover overhead before there is net profit. Check individual jobs with the job gross margin calculator.
7. Close rate
Jobs sold ÷ quotes given × 100. It shows how often an estimate turns into work. A very high close rate can mean your prices are too low. A very low one can point to pricing, presentation or the wrong kind of leads.
How to track them without drowning in data
- Start with three. First-time fix rate, average ticket and gross margin give a useful picture on their own.
- Define each one in writing. A callback or a completed job must mean the same thing every month.
- Measure on a fixed schedule. Monthly is enough for most small shops.
- Compare with your own history. Your trend matters more than an industry average from a different market.
- Share the numbers with the team. Technicians cannot improve a figure they never see.
Read them together
No single KPI is safe on its own. Average ticket can rise while close rate falls. Utilization can look healthy while callbacks eat the margin. Lay the numbers side by side and look for the one that moved first.
A warning about targets
When a number becomes a target with pay attached, people find ways to hit it that do not help the business. Callbacks stop being recorded and jobs get closed early. Use KPIs to find problems and start conversations, and be careful about tying them directly to individual pay.
Related guides
- In the Customer’s Home: Etiquette Every Field Technician Should Follow
- HVAC Unit Conversions Every Technician Should Know
- Average Service Ticket: What It Tells You and How to Raise It Honestly
Three Excel workbooks that take you from what a technician costs to what to charge, then show whether each job made money.
Not sure yet? Try two forms free or see all packs.