


You pay a technician for 40 hours. How many of those hours were spent in front of a customer’s equipment? For most service businesses the honest answer is lower than the owner expects, and the gap is where a good deal of profit goes. Technician utilization is the measure that shows it.
How to calculate it
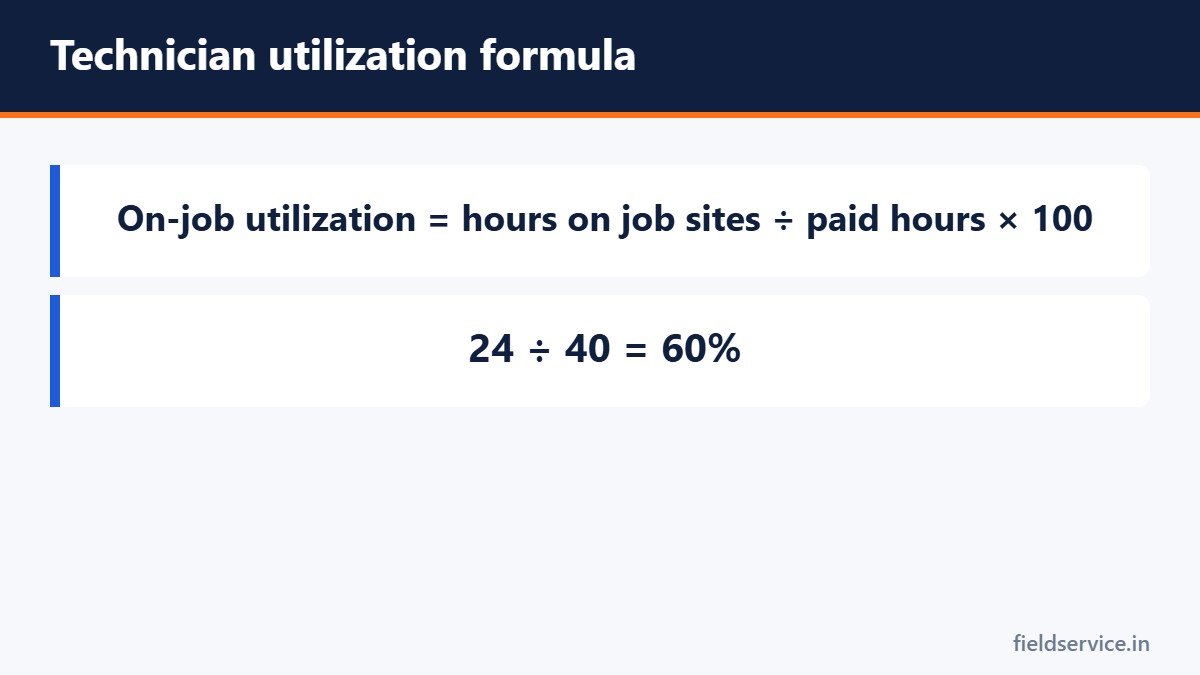
Take the hours a technician spent on job sites in a period and divide by the hours you paid for. A tech who was on jobs for 24 hours out of a 40-hour week has an on-job utilization of 60 percent.
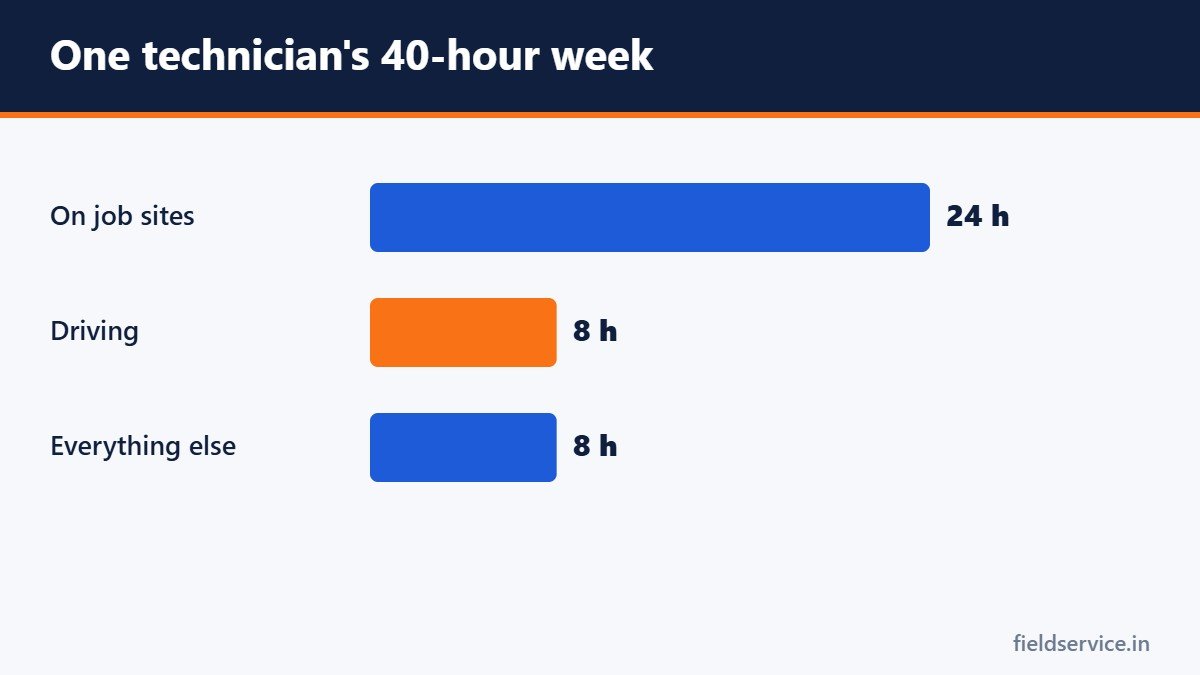
It helps to calculate a second version that includes drive time. If the same tech drove for 8 hours, 32 of the 40 hours were either on a job or on the way to one, which is 80 percent. The remaining 8 hours went on everything else. The technician utilization calculator gives you all three figures.
Utilization is not the same as billable hours
A technician can be on a job site without that time being billed. Warranty work, callbacks and time spent waiting for a customer all count as on-job time and bring in nothing. Billable utilization looks only at the hours that end up on an invoice, and it is usually the lower of the two numbers. Track both. The billable utilization calculator handles the second one.
Where the other hours go
- Morning meetings and loading the truck
- Driving between jobs and to the supply house
- Waiting for parts, for access or for a customer to come home
- Paperwork and phone calls
- Gaps in the schedule between appointments
- Training
Some of this is necessary. Training and a short morning meeting pay for themselves. The aim is not to remove non-job time but to know how much there is and which parts of it are waste.
What a good number looks like
There is no single target that fits every business. A commercial tech with two long jobs a day will show higher on-job time than a residential tech running six short calls across a city. Rural routes mean more driving. Compare your number with your own past months before you compare it with anyone else’s.
What you can say is that 100 percent is neither possible nor healthy. A schedule with no slack produces late arrivals, rushed work and callbacks.
How to improve it
- Route by area. Group calls geographically so drive time falls.
- Stock the truck properly. Each avoided parts run returns most of an hour. See our service vehicle stocking guide.
- Confirm appointments. A text the day before cuts the number of wasted trips to empty houses.
- Shorten the morning. Dispatch from home where it makes sense, and have trucks restocked the evening before.
- Make paperwork quick. Notes entered on a phone at the job are faster than forms filled in at the shop.
- Fill gaps on purpose. Keep a list of maintenance visits that can be moved into a cancelled slot.
Read it with other numbers
Utilization on its own can mislead. A tech can be on job sites all week and still lose money if the work is callbacks. Look at it next to first-time fix rate and revenue per technician. High utilization with low revenue means the time is being spent and not being billed.
Measure it weekly for a month before changing anything. The pattern across technicians and across days of the week usually points to the fix.
Related guides
- Warranty Work: How to Track It and Stop It Draining Profit
- Arrival Windows: How to Schedule Service Calls Customers Can Plan Around
- 7 Field Service KPIs Every Small Service Business Should Track
Three Excel workbooks that take you from what a technician costs to what to charge, then show whether each job made money.
Not sure yet? Try two forms free or see all packs.